Drawing Graphs on the BT82x
BT82x Series Graph Drawing
This tutorial describes methods and options for graph drawing on the BT82x.
It uses the Eve-MCU-Dev EVE library for embedded MCUs and the python-bt82x-dev library for python.
This project requires a BridgeTek BT82x board and display. It is written to demonstrate methods for drawing graphs on BT82x.
Contents
Table of Contents
Introduction
This document captures the programming details for graph drawing with the BT82x Series chips. This document only provides additional information to that found in the BT82X Series Programming Guide.
The methods described here show the options available and relative advantages and disadvantages of each.
Scope
This document will show suggested methods for displaying graphs. The BT82x programming guide has information on the standard co-processor commands. Methods described in this document add to the range of available co-processor commands.
Conventions
All values are in decimal by default.
The values with 0x are in hexadecimal.
The values with 0b’ are in binary.
The endianness of commands, register values, and data in RAM_G are in little-endian format.
Host refers to the MCU/MPU with SPI master interface connecting with EVE.
Host Commands refer to the EVE specific commands defined in the “Host Commands” section in the BT82X Series Programming Guide.
The phrase “patch” is used in this document to refer to a patch file which may contain both code fixes or additional features (extensions).
Intended Audience
The intended audience of this document are Software Programmers and System Designers who develop graphical user interface (GUI) applications on the BT82x series of devices.
API Reference Definitions
The following table provides the functionality and nomenclature of the APIs used in this document.
API |
Description |
|---|---|
wr32() |
Write 32 bits to intended address location | |
rd32() |
Read 32 bits from intended address location | |
cmd() |
Write 32 bits data to command FIFO i.e., RAM_CMD | |
cmd_*() |
Write 32 bits command with its necessary parameters to command FIFO i.e., RAM_CMD. | |
dl() |
Write 32 bits display list command to RAM_DL. | |
host_command() |
Send host command to EVE | |
Table 1 – API Reference Definitions
Graphing Overview
The BT82x has a built-in BARGRAPH bitmap type that can simplify drawing a simple bargraph style (area under the line shaded) graph as a BITMAP type in a display list. Other methods of drawing a graph are using a LINE_STRIP or POINTS to show line graphs and point data on a chart.
BARGRAPH
The simple BARGRAPH format can be used with a BITMAP primitive to draw an area under shaded graph. This can be scaled, rotated and transformed like any other bitmap type.
It takes a one-dimensional array of 8-bit unsigned data to generate the graph. The source data is stored in RAM_G.
Lower numbers in the source data are higher lines on the graph. Hence the maximum points on the graph will be at 0 in the data-set and the minimum points on the graph will be at 255 in the data-set. A graph can be flipped using transforms to change this or drawn in a background colour over a rectangle of the foreground colour. The bitmap cell function can be exploited to store multiple graphs within the same bitmap and hence bitmap handle.
Example
Here is an example of a BARGRAPH:
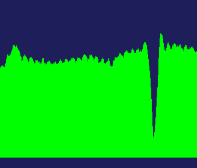
Figure 9 Simple BARGRAPH Example
The code to turn a one-dimensional data set with 400 points into a graph is as follows:
BITMAP_HANDLE(0)
BITMAP_SOURCE(0)
BITMAP_SIZE_H(0, 0)
BITMAP_SIZE(NEAREST, BORDER, BORDER, 400, 256)
BITMAP_LAYOUT_H(0, 0)
BITMAP_LAYOUT(BARGRAPH, 400, 1)
BEGIN(BITMAPS)
BITMAPHANDLE(0)
COLOR_RGB(0, 255, 0)
CELL(0)
VERTEX2F(10, 10)
The height component of the BITMAP_LAYOUT is set to 1 since that is the height of the data-set. The height component of the BITMAP_SIZE is set to 256 to encompass the full range of the data (i.e. 0 to 255).
The bargraph bitmap is drawn simply with a VERTEX2F or VERTEX2II command as with other bitmaps. The same graphics context applies to these bitmaps as well as other normal bitmaps.
Discussion
There are benefits and drawbacks to using the BARGRAPH format.
The benefits are: - The one-dimensional array can be updated in RAM_G and read directly by the Render Engine to display the graph. No further resources or computations are required. - The display list sets up the bitmap properties once allowing the bitmap to be used in subsequent display lists without reconfiguring the bitmap. - The CELL or VERTEXT2II command can allow multiple graph bitmaps to be built and stored in the same bitmap handle. - The method is fast since there are no intermediate effects and all computations are within the Render Engine. - The bitmap of the graph can be scaled, rotated or transformed as with any other bitmap.
There are some drawbacks to this method: - The drawn graph is not anti-aliased. This may not be necessary in an application but with care drawing the bitmap a pleasing optical effect can be generated. This is discussed later in the Advanced Chapter. - A line graph cannot be shown with this method. A workaround is discussed later in the Advanced Chapter. - Changing the scale of an axis requires a bitmap transformation.
LINE_STRIP
To draw a line graph the natural primitive to use would be the LINE_STRIP method and VERTEX2F commands to draw lines between individual points on a chart. This requires that the display list is filled with commands to draw the line of the line graph.
There is no native type to draw a line graph in this way therefore there needs to be external processing of the data-set to produce the points list.
Example
Here is an example of a graph drawn with a LINE_STRIP.
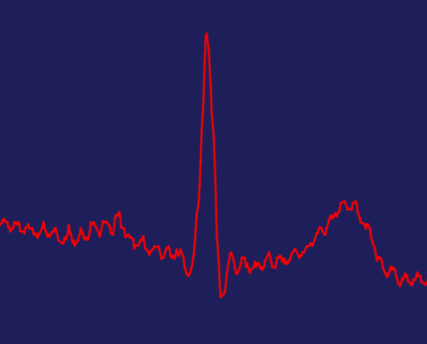
Figure 9 Simple LINE_STRIP Example
The code to produce this line graph is as follows:
COLOR_RGB(255, 0, 0)
REGION(1, 63, 824)
BEGIN(4)
VERTEX2F(14, 319)
VERTEX2F(15, 318)
VERTEX2F(16, 315)
VERTEX2F(17, 316)
VERTEX2F(19, 322)
VERTEX2F(20, 321)
VERTEX2F(21, 324)
VERTEX2F(24, 324)
VERTEX2F(25, 319)
VERTEX2F(26, 312)
VERTEX2F(27, 307)
VERTEX2F(29, 310)
VERTEX2F(30, 312)
…
END()
As the code demonstrates each point on the x-axis has a corresponding y-axis address defined by the input data-set.
Discussion
There are benefits and drawbacks to using the LINE_STRIP format.
The benefits are: - The VERTEX2F points are read directly by the Render Engine to display the graph. No further resources or computations are required. - The drawn graph is anti-aliased and can be drawn with a specified width using the LINE_WIDTH command. - The line uses all the options in the graphics context including transparency.
There are some drawbacks to this method: - The points for the LINE_STRIP have to be computed from a one-dimensional data-set. There is no built-in method of changing the input data to VERTEX2F points. - This cannot be used to draw an area-under graph. - Since each point used to draw the line takes a VERTEX2F command it can add a relatively large number of instructions to the display list. - The VERTEX2F command has 14 bit precision so with some settings of VERTEX_FORMAT and larger graphs there may be a need to add VERTEX_TRANSLATE_X/Y commands to allow the VERTEX2F to address some screen points.
EDGE_STRIP
As an alternative to the BARGRAPH format the same principles applied in the LINE_STRIP method can be changed to (in the simplest case) an EDGE_STRIP_B to make an area under graph from the same data as a LINE_STRIP graph. The edge strip will go to the end of the screen display so a scissor operation is needed to keep the graph within the bounds.
POINTS
If a line or bar graph are not wanted and solely points are to be displayed then the POINTS method and the VERTEX2F method described above would be wanted. Of course, the points could be replaced by a bitmap or other glyph to indicate the points in the dataset.
Advanced Chapter
In this chapter more advanced graph drawing options are explored.
When sending large data sets to the BT82x it is normal to compress the data for transfer using the coprocessor hardware compression to reduce transfer times. However, it is still possible to write directly into memory if that is preferred.
Compressed data can be sent in the https://github.com/Bridgetek/python-bt82x-dev there are API commands called cmd_inflate and ram_cmd for an array or load for a file handle. The address in RAM_G to store the data in is passed in the cmd_inflate command.
# Send the commands to the BT82x
eve.cmd_inflate(address, 0)
eve.ram_cmd(zlib(vertex.tobytes()))
eve.finish()
A write to the coprocessor or RAM_G can be achieved in a single SPI burst so this can be performed quickly. There will be options in the API for programming the BT82X for writing to RAM_G either through the coprocessor or directly.
Error Bars
Other options could be to use LINES to draw error bars onto the graph.
Scrolling
The BARGRAPH dataset memory can be “scrolled” by using the coprocessor CMD_MEMCPY command to move them a certain number of bytes from lower to higher memory addresses. Once the copy has completed the lower bytes can be written to add new data to the start of the trace.
The CMD_MEMCPY starts at the low address and moves byte-wise to higher addresses.
There are synchronisation commands in the coprocessor to ensure that the copy only occurs when the Render Engine is not accessing the data.
Subtractive Overlays
A simple method to draw a line-style graph using the BARGRAPH method is to use a subtractive overlay. This will draw two graphs: an upper graph which is a set height above the actual data-set; and a lower graph which is below the data-set values. The upper graph is in the foreground colour while the lower graph is in the background colour. The 2 graphs are very similar but drawing the lower graph over the upper graph will result in a difference line remaining visible. The remaining difference is a line graph.
Since the 2 graphs will be of an identical length they can be treated as part of one data-set and be used to make 2 CELLs of a BITMAP like font characters. This allows one handle to be used for both graphs.
Example
A good method of computing the 2 graphs in python and Numpy is as follows:
import numpy as np
dataset_l = np.array([], dtype=np.uint8)
dataset_h = np.array([], dtype=np.uint8)
prev_y = 256
for y in dataset:
    # Scale to 0-255, clip, invert Y
    yi = min(255, max(0, 255 - y))
    # addr0 holds the low Y, addr1 the high Y
    if yi < prev_y:
        (lo, hi) = (yi, prev_y)
    else:
        (lo, hi) = (prev_y, yi)
    prev_y = yi
    dataset_h = np.append(ecg8h, lo)
    dataset_l = np.append(ecg8l, min(255, hi + 2))
dataset_combined = np.concatenate([datset_h, dataset_l], dtype=np.uint8)
To display the two graphs (made from 400 data points) it is similar to the BARGRAPH described earlier except that the data-set is made from 2 sets of 400 points. Resulting in 800 points of data
BITMAP_HANDLE(0)
BITMAP_SOURCE(0)
BITMAP_SIZE_H(0, 0)
BITMAP_SIZE(NEAREST, BORDER, BORDER, 400, 256)
BITMAP_LAYOUT_H(0, 0)
BITMAP_LAYOUT(BARGRAPH, 400, 1)
BEGIN(BITMAPS)
BITMAPHANDLE(0)
COLOR_RGB(0, 255, 0)
CELL(0)
VERTEX2F(10, 10)
CELL(1)
VERTEX2F(10, 10)
The resulting line graph will look like this:
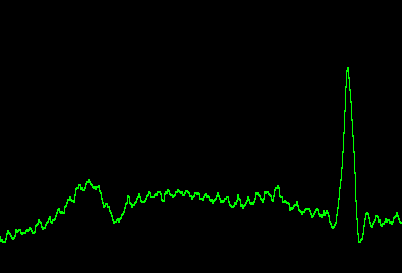
Figure 9 Subtractive Overlay Example
Discussion
The line graph obtained is not ant-aliased and may lose some resolution but is a fast and efficient to draw and takes up little display list memory.
Precomputed Display List
Premade display list entries can be generated on a host MCU and copied into RAM_G. The coprocessor can add the entries from RAM_G directly to the display list using the CMD_APPEND command.
Example
One method of generating an array of VERTEX2F commands using python and Numpy would be:
import numpy as np
# Create numpy array for C type uint32_t
vertex = np.array([], dtype='<I')
# Add a VERTEX_FORMAT(2) command (1/4 pixel precision)
vertex = np.append(vertex, 0x27000002)
# Add a BEGIN(LINE_STRIP) command
vertex = np.append(vertex, 0x1f000004)
# For each point in the data set
for (x,y) in dataset:
    # Add a VERTEX2F(x,y) command
    vertex = np.append(vertex, 0x40000000 + ((int(y) * 4) & 0x7ffff) +
            (((int(x) * 4) << 15) & 0x3fff8000))
# Finally add an END() command
vertex = np.append(vertex, 0x21000000)
This will convert a dataset containing an iterable array of (x,y) coordinates into vertex commands for the BT82x RAM_G.
To enact the commands in a display list, first it is necessary to send the commands to RAM_G. The method to achieve this is shown in the documentation of the API chosen to program the BT82x.
Then to add the commands from RAM_G to the display list the CMD_APPEND coprocessor command is called with the address of the start of the list and the number of bytes in the list. The length must be a multiple of 4 since each display list command is a 32-bit integer.
Discussion
This method relies on using the host MCU to perform translations to make a display list in memory which is transferred to the BT82x later. The chosen API used to program the BT82x can be reused to write to host MCU memory. It also has the advantage of being able to filter or process the graph for efficiency – perform point reduction or band-pass filtering.
There is a small advantage in using this method in that data is compressed in transit and for larger sets of data will be faster than writing the display list directly. The VERTEX2F data will still be in memory for subsequent passes if it is to be reused another CMD_APPEND can be issued to the coprocessor when another display list is made.
Lines cannot be “scrolled” simply though since x,y coordinates are inherent in the VERTEX2F commands. It is possible to use a window on the memory storing the VERTEX2F commands and VERTEX_TRANSLATE_X to give the appearance of scrolling while data is appended from a moving address. This is harder to setup and use but a valid method of use.
Appendix A - Revision History
Document Title: Drawing Graphs on the BT82x
Product Page: https://brtchip.com/product/bt820b/
Revision |
Changes |
Date |
|---|---|---|
1.0 |
Initial Release |
16/04/2025 |